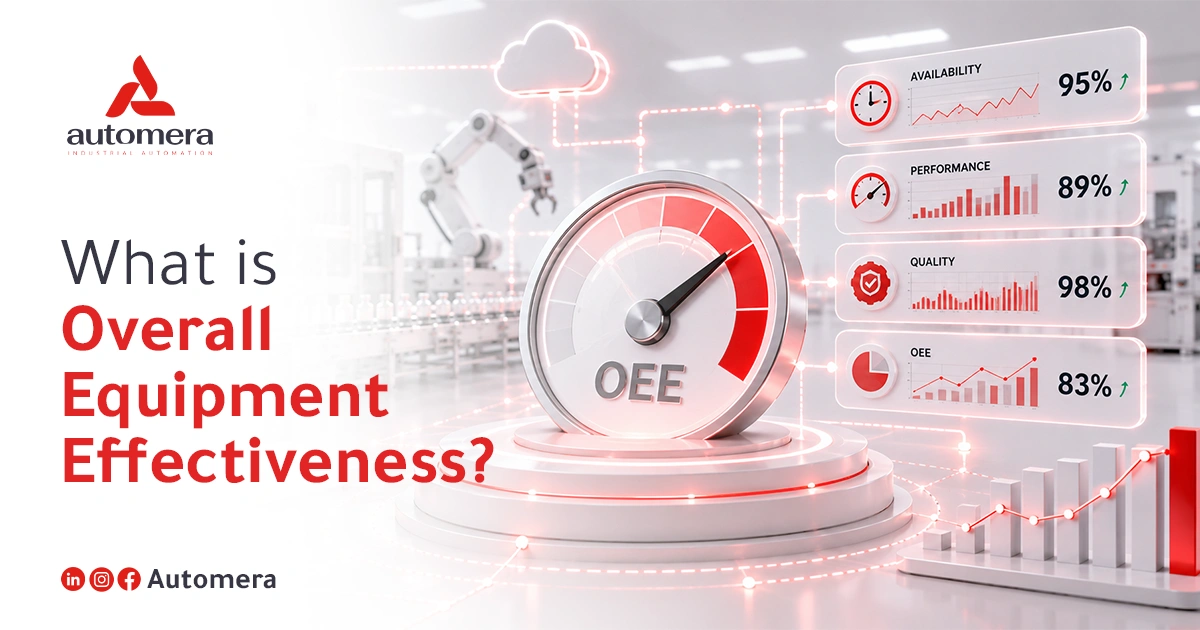
Knowing how long your equipment runs or how much it produces at the end of the day only shows part of the picture. Overall Equipment Effectiveness (OEE) combines availability, performance, and quality to provide a more accurate assessment of what your factory equipment actually achieves.
Automera provides a complete guide with OEE explained clearly, covering its main components, calculation formula, implementation inside the factory, monitoring tools, and practical steps for improving results.
What Is overall equipment efficiency definition?
overall equipment effectiveness meaning is a metric that measures how efficiently factory equipment is used during planned production time. It is calculated using three components:
- Availability: The percentage of planned production time during which the machine was actually running.
- Performance: How closely the machine’s actual operating speed matches its target speed.
- Quality: The percentage of good products out of the total quantity produced.
After learning the Overall Equipment Effectiveness definition, we can now explore why OEE is important in manufacturing.
Why Is OEE Important in Manufacturing?
Your factory may meet its daily production target while still losing operating hours and production capacity. OEE reveals these hidden losses, identifies their causes, and helps your team focus on the areas that require improvement.
- Understanding actual production capacity: Shows the difference between what your equipment can produce and what it actually produces.
- Identifying the source of losses: Separates availability, performance, and quality losses so the team knows where to begin.
- Setting work priorities: Helps management direct maintenance time and operational efforts toward the problems with the greatest impact on production.
- Increasing output with existing equipment: Reveals opportunities to produce more by addressing current losses before purchasing additional machinery.
- Measuring improvement: Shows whether maintenance, training, or operational changes have delivered measurable results.
Benefits of Improving Overall Equipment Effectiveness (OEE)
Improving operational equipment effectiveness gives your factory an opportunity to increase output using its current capabilities before expanding operations or purchasing new equipment. Its main benefits include:
- Better equipment utilization: Keeping machines running for longer at the appropriate speed increases the value gained from existing assets.
- Lower production costs: Addressing the causes of losses reduces breakdowns, waste, and material consumption caused by defective products.
- More consistent product quality: Monitoring quality during production reduces repeated defects and rework.
- More targeted maintenance: OEE data identifies equipment with frequent downtime and helps maintenance teams prioritize it.
- Greater customer confidence: Consistent quality and reliable delivery reduce delays and product-related complaints.
How to Calculate oee overall equipment effectiveness
calculate overall equipment effectiveness using three components: availability, performance, and quality. The overall equipment effectiveness formula is: OEE = Availability × Performance × Quality
Here is how to calculate each component:
1. Availability
Availability measures the percentage of planned production time during which the machine was actually running. It decreases when breakdowns, equipment setup, or product changeovers cause downtime.
Availability = Actual Run Time ÷ Planned Production Time
2. Performance
Performance compares the machine’s actual production speed with its ideal speed. It helps identify slow cycles and short stops that reduce the number of units produced.
Performance = (Ideal Cycle Time × Total Units Produced) ÷ Actual Run Time
3. Quality
Quality measures the percentage of products that meet specifications the first time, excluding defective units and products that require rework.
Quality = Good Units ÷ Total Units Produced
Practical OEE Calculation Example
The following Overall Equipment Effectiveness example shows how to calculate OEE using actual production time, output, and quality data.
- Planned production time: 480 minutes
- Downtime: 60 minutes
- Actual run time: 420 minutes
- Ideal cycle time: One minute per unit
- Total output: 380 units
- Good units: 350 units
The three OEE components are calculated as follows:
- Availability: 420 ÷ 480 = 87.5%
- Performance: (1 × 380) ÷ 420 = 90.5%
- Quality: 350 ÷ 380 = 92.1%
OEE = 0.875 × 0.905 × 0.921 = 72.9%
This means the machine achieved an Overall Equipment Effectiveness score of approximately 73% during the planned production time.
6 Operational Losses Due to the Absence of an OEE System in Factories
The Six Big Losses describe the most common causes of reduced equipment effectiveness. They are grouped under the three OEE components discussed earlier: availability, performance, and quality.
- Equipment breakdowns: Unplanned machine failures reduce actual run time and may disrupt other production stages when equipment is connected across the line.
- Setup and changeovers: Time spent preparing equipment or changing molds, materials, and settings between products reduces the time available for production.
- Small stops: Machines may stop briefly because of material shortages, jams, or minor adjustments. Although each stop is short, frequent interruptions can significantly reduce output.
- Reduced operating speed: Equipment operating below its ideal speed because of wear, poor material quality, or incorrect settings produces fewer units.
- Production defects and rework: Products that fail to meet specifications reduce the quality rate, whether they are discarded or require correction and reprocessing.
- Startup losses: These occur when a machine starts operating or after a changeover, while the process stabilizes and product quality reaches the required standard.
Measuring each loss helps identify the actual cause of a lower OEE score and directs production and maintenance teams toward the problems that require attention.
OEE Benchmarks Across Different Industries
After calculating oee for operators overall equipment effectiveness, the next question is usually: What is considered a good OEE score? The following ranges provide a general reference:
- Below 65%: Indicates clear equipment or production losses that need to be identified and addressed.
- 65% to 75%: A common result in many factories, with clear opportunities for improvement.
- 75% to below 85%: Indicates strong performance and good control over production losses.
- 85% or higher: Often described as a world-class OEE level in discrete manufacturing.
These ranges are not universal standards. A packaging line, CNC machine, and pharmaceutical filling line may each require a different target depending on process complexity, equipment type, product variation, and changeover frequency.
How to Set Appropriate OEE Targets for Your Facility
You should not begin with an 85% target simply because it is commonly associated with world-class performance. The right target should challenge your team while remaining achievable within your factory’s current capabilities. You can set a realistic target through the following steps:
- Measure current performance: Record OEE results over a sufficient period to identify the average score and variations between shifts.
- Consider operating conditions: Set the target according to equipment age, product type, and changeover frequency.
- Aim for gradual improvement: Begin with a measurable increase, then set a higher target after achieving it.
- Involve machine operators: Discuss the causes of losses with operators, as they are closest to the daily details of equipment operation.
- Review the target regularly: Adjust the target when performance improves or when equipment and production plans change.
Uses of Overall Equipment Effectiveness (OEE)
OEE becomes useful when it moves beyond being a percentage in a report and helps the factory identify where production is being lost and what action should be taken. Its main uses include:
- Identifying the causes of lower output: Shows whether production losses come from equipment downtime, reduced operating speed, or higher defect rates.
- Setting maintenance priorities: Directs the maintenance team toward machines whose failures cause the greatest loss of production time.
- Increasing output from existing equipment: Reveals unused time and production capacity before the factory purchases additional machinery.
- Comparing performance: Shows differences between shifts or similar production lines and helps other teams adopt more effective working methods.
- Measuring the impact of changes: Quantifies the results of adjusting machine settings, performing maintenance, or training operators.
- Monitoring assets on a wider scale: oae overall asset effectiveness (OAE) can be used to evaluate the performance of a broader group of factory assets.
How Can OEE Improve Maintenance?
oee operational equipment efficiency data shows how equipment failures affect operating time and production output. It helps maintenance teams move from repairing failures after they occur to addressing their recurring causes.
- Identifying equipment with frequent downtime: Availability records show which machines lose the most production hours because of breakdowns.
- Prioritizing maintenance work: Directs technicians, time, and spare parts toward equipment with the greatest impact on the production plan.
- Detecting recurring failures: Recording the cause and duration of each stop reveals patterns that require a permanent solution.
- Planning preventive maintenance: Historical operating data helps teams schedule maintenance before a more serious stoppage occurs.
- Measuring maintenance results: Comparing OEE before and after repairs shows whether the action reduced downtime and improved performance.
- Coordinating maintenance and production: Both teams work from the same data, including when the failure occurred, its cause, and its impact on production.
Steps for Successful OEE Implementation
At Automera, we implement an overall machine efficiency measurement system in your factory through a clear process:
- Assessing production lines: We identify critical equipment and bottlenecks with the greatest impact on output.
- Connecting equipment to the system: We collect operating time, downtime, production, and defect data directly from machines.
- Setting measurement standards: We define ideal cycle times, downtime reasons, and the rules for calculating good units.
- Building a monitoring dashboard: We display availability, performance, quality, and the overall OEE score in real time.
- Training the factory team: We show operators and supervisors how to use the system and interpret its results.
- Analyzing production losses: We identify the causes of reduced effectiveness and the equipment with the greatest impact on output.
- Tracking improvement: We compare results over time and measure the impact of maintenance and operational actions.
Common OEE Challenges and How to Overcome Them
The OEE formula is simple, but the accuracy of its result depends on how production data is collected and used. Common challenges include:
- Inaccurate data: Missing short stops or recording incorrect downtime reasons produces a score that does not reflect actual performance.
- Operator resistance: Employees may view OEE as a tool for monitoring or evaluating them. Teams should understand that its purpose is to improve equipment and production processes, not judge individuals.
- Focusing only on the final score: Knowing that OEE is 70% does not show what needs to be fixed. Availability, performance, and quality must be reviewed separately to identify the source of the loss.
- Inconsistent data entry: Comparisons become unreliable when operators record the same downtime reason in different ways.
- No action after measurement: Collecting data without an improvement plan turns OEE into another report. Once a problem is identified, the factory should assign and begin corrective action.
- Stopping follow-up too early: Reviewing OEE for a short period does not reveal performance trends. Results should be monitored regularly as part of the factory’s daily routine.
Overview of oee overall equipment efficiency Software Solutions
OEE can be calculated manually, but this becomes more difficult as the number of machines and production stops increases. Factories therefore use several tools to collect, calculate, and display OEE data. Common OEE software solutions and supporting technologies include:
- Manufacturing Execution Systems (MES): Collect production, downtime, and quality data directly from the factory floor.
- Internet of Things sensors: Automatically record machine status, cycle counts, run time, and downtime.
- Monitoring dashboards: Display OEE and its components in real time and show which equipment requires attention.
- Cloud platforms: Allow companies to monitor multiple production lines or factories through one interface.
- Reports and analytics: Identify the causes of production losses and compare performance across periods and similar equipment.
Key Features to Look for in OEE Measurement Tools
An OEE system should do more than calculate a percentage. It should explain why the score has dropped and help the factory team address the cause. Look for the following features:
- Automated data collection: Direct machine connectivity for recording run time, downtime, and production output.
- Downtime reason tracking: Records the cause, duration, and affected equipment for every stop to identify recurring losses.
- Clear monitoring dashboards: Present availability, performance, and quality in a format that operators and managers can understand without complex reports.
- Real-time alerts: Notify the responsible team when a machine stops, slows down, or produces lower-quality output.
- Loss analysis: Rank breakdowns, stops, and defects according to their impact on production.
- System integration: Exchange data with ERP, MES, CMMS, and other factory systems.
- Scalability: Add new equipment, production lines, and sites without replacing the system.
Latest Trends in OEE
Overall effective efficiency OEE is moving toward more accurate measurement, faster response, and less reliance on manual data entry. Equipment data is increasingly being used to trigger direct action on the factory floor. The latest trends include:
- Artificial intelligence: Detects patterns in downtime, reduced speed, and defects to identify problems that require early intervention.
- Industrial Internet of Things (IIoT): Collects data automatically from machines and sensors throughout production.
- Predictive maintenance: Uses performance history and equipment condition data to identify potential failures before they stop the line.
- Digital twins: Simulate the impact of changing machine settings, operating speed, or maintenance plans before applying those changes.
- Factory-wide analysis: Expands monitoring from a single machine to assets, production lines, and multiple factory locations.
- Operator empowerment: Gives frontline workers direct access to live data, allowing them to respond without waiting for end-of-day reports.
Start with one production line and discover where your factory is actually losing time and output. Contact Automera to implement an OEE system tailored to your equipment and bring your operational data together in one clear platform.